Wallstreetbets gains and losses
4013 trades with 2231 gains and 1782 losses.
Welcome! Please note that as of April 17, 2021 no new data will appear on the site. However, 14 months' historical data (February 2020 to April 2021) is still here for you to explore!
Recent Trades
- 2021-04-16 Loss $86,736 Little brother of "The squeez…
- 2021-04-16 Gain $462,885 My CLOV Positions - Much more…
- 2021-04-16 Loss $3,107 UWMC stands for "Uh-oh, Wiped…
- 2021-04-16 Gain $139,750 Happy DFV day y’all
- 2021-04-16 Loss $15,494 Whatever, I still like the st…
- 2021-04-16 Gain $257,761 Hi Citron🍋👋💎💎RIOT🚀🚀🚀
- 2021-04-16 Loss $52,500 Loss porn $RIDE Feels good my…
- 2021-04-16 Loss $86,395 -99.99% I shall now take my s…
- 2021-04-16 Gain $24,081 GME - 5000% 4/16 30c - Exerci…
- 2021-04-16 Loss $17,170 “We are being fucked, but we …
All Time Stats
2231 gains $353,966,876
1782 losses $110,090,768
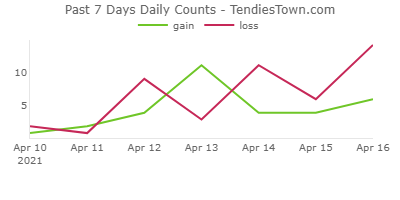
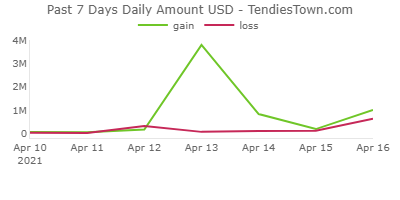
Past 7 Days Stats
34 gains $6,227,147
56 losses $1,629,396
Top 10 Tickers - All Time
By sum and (count)
Gain
- GME $112,239,516 (480)
- TSLA $48,724,192 (122)
- BB $7,595,606 (98)
- NIO $5,731,025 (84)
- PLTR $5,260,867 (88)
- TLRY $5,250,256 (16)
- AMD $3,786,087 (5)
- PRPL $3,441,313 (3)
- RKT $2,661,531 (22)
- LGVW $2,335,025 (1)
Loss
- GME $55,756,187 (437)
- BB $2,710,027 (66)
- PLTR $1,891,212 (97)
- TSLA $1,175,386 (48)
- AMC $1,032,274 (36)
- SPCE $641,624 (4)
- FSLY $584,630 (2)
- SPY $513,008 (19)
- AMZN $488,391 (12)
- RIOT $466,496 (2)
Top 10 Tickers - Past 7 Days
By sum and (count)
Gain
- NVDA $777,544 (1)
- CLOV $462,885 (1)
- GME $452,528 (11)
- NVCR $442,901 (1)
- RIOT $365,371 (2)
- TSLA $228,337 (5)
- FUBO $130,000 (1)
- BABA $60,112 (2)
- AMZN $31,324 (1)
- PLTR $29,942 (3)
Loss
- GME $818,859 (21)
- PLTR $135,805 (6)
- FUBO $124,975 (1)
- NNOX $92,300 (1)
- TSLA $70,826 (5)
- SPY $61,127 (2)
- RIDE $52,500 (1)
- APHA $40,428 (2)
- AMC $31,882 (2)
- GOEV $25,921 (1)
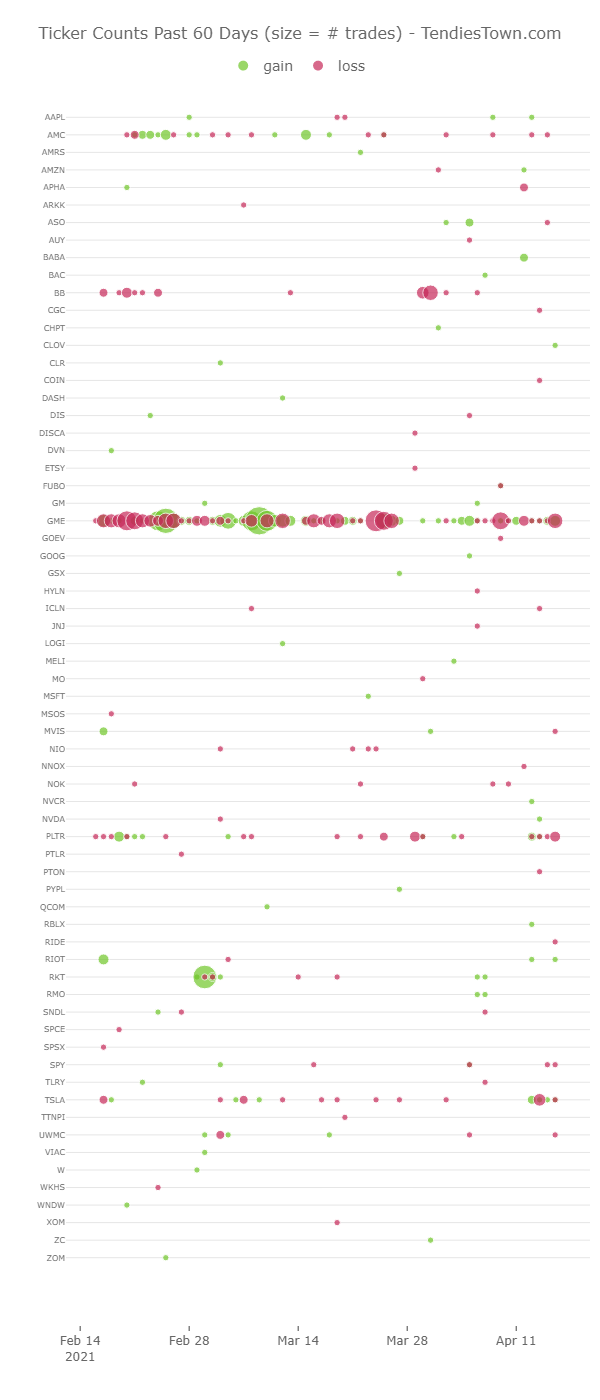
Tickers Counts Past 60 Days
For trades with ticker identified
Analysis and Insights
The table below provides summary statistics of the gains and losses reported to-date. The average and median amounts are actually quite large, perhaps because smaller gains or losses are not as likely to be reported.
| Gain | Loss | |
|---|---|---|
| Count | 2231 | 1782 |
| Sum | $353,966,876 | $110,090,768 |
| Avg | $158,658 | $61,779 |
| Median | $24,563 | $12,009 |
| Min | $0 | $0 |
| Max | $8,000,000 | $14,776,725 |
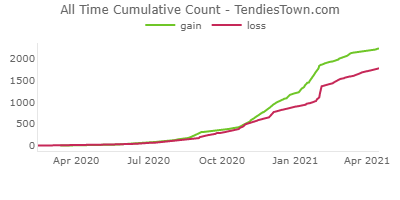
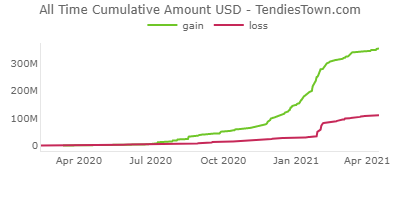
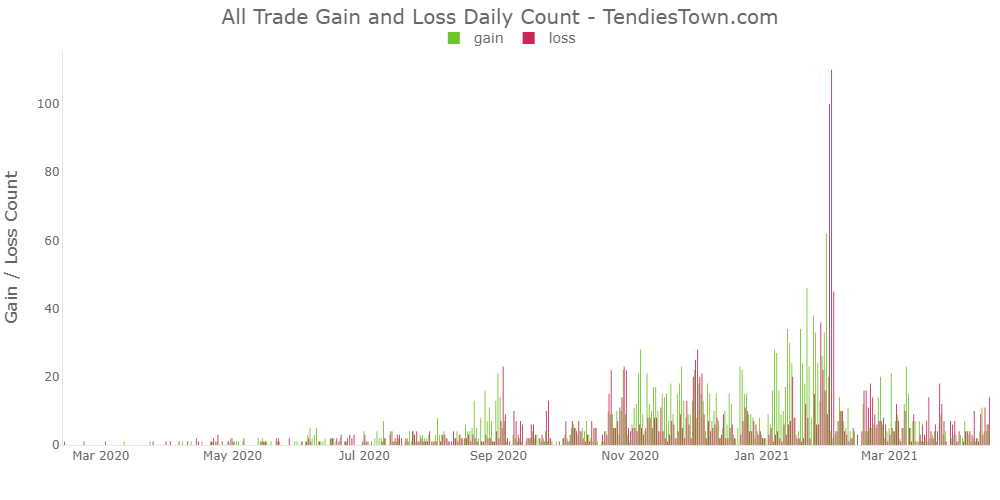
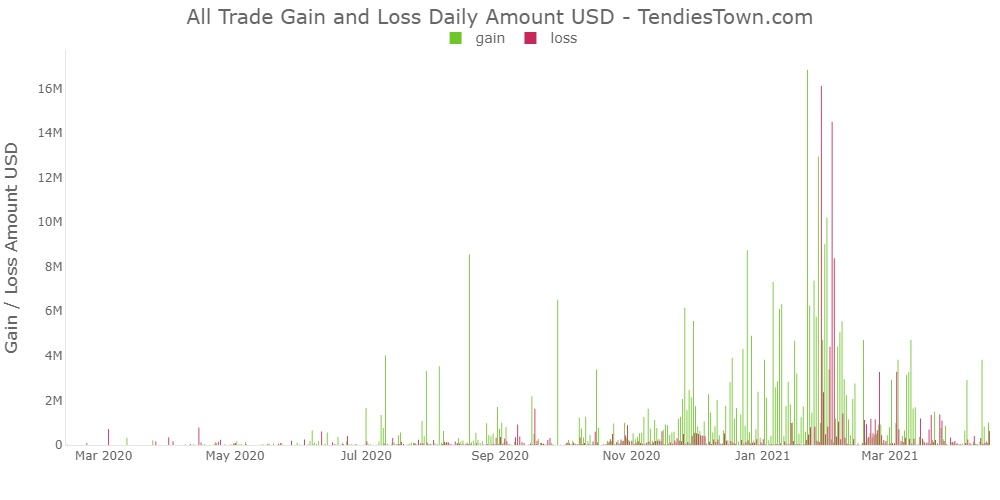
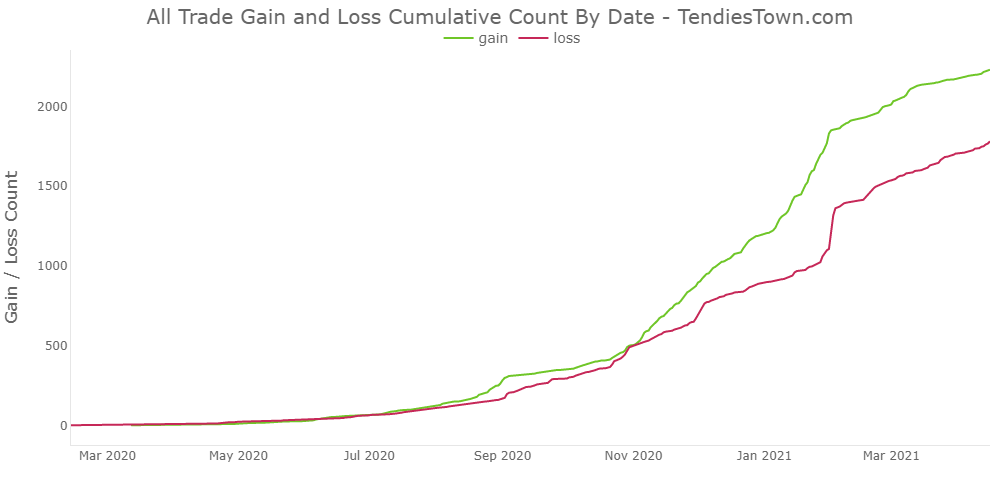
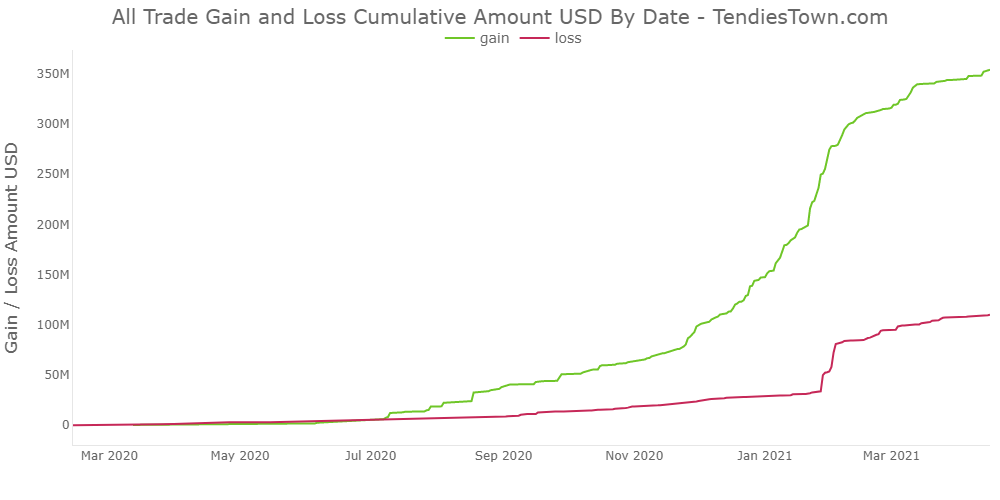
The first four charts below show counts and amounts of gains and losses by date. The first two show daily counts and amounts and the last two show cumulative counts and amounts.
The increase in frequency of reported gains and losses starting in March 2020 coincides with the surge of the Robinhood retail trader phenomena.
The most notable observation is that while gain and loss counts are roughly equal and keping pace with each other, the amount of gains is much greater than losses. Perhaps people are less likely to report losses, especially larger losses.
Click on charts to enlarge.
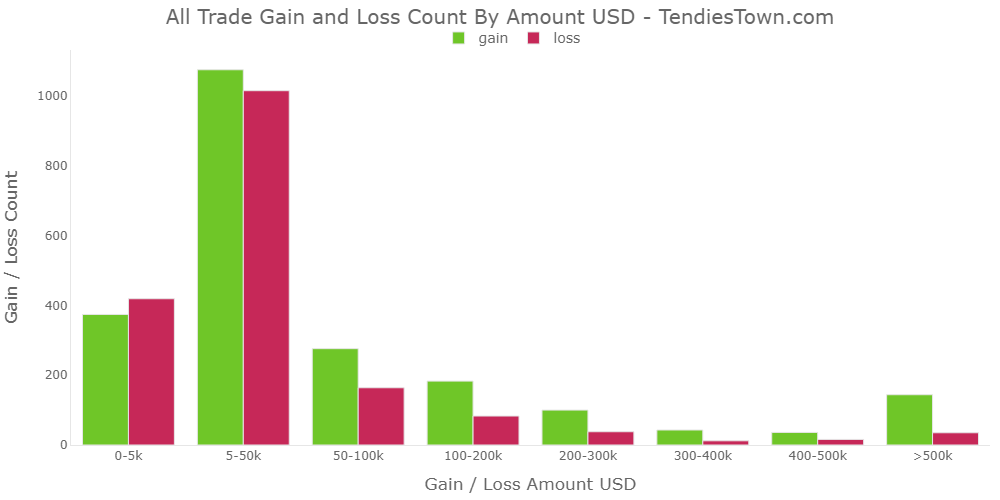
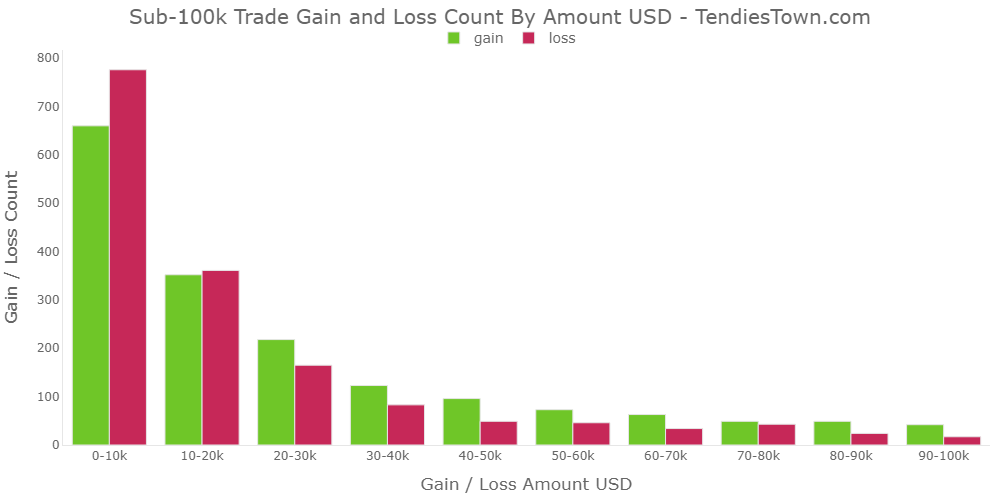
The next two charts show gains and losses by amount ranges to help identify gain and loss distribution by count and amount. Both gains and losses are mostly below 100k. Sub-100k gains and losses are mostly below 30k with majority in 0-10k range. Gains exceed losses in every amount ranges with exception of the smallest ranges.
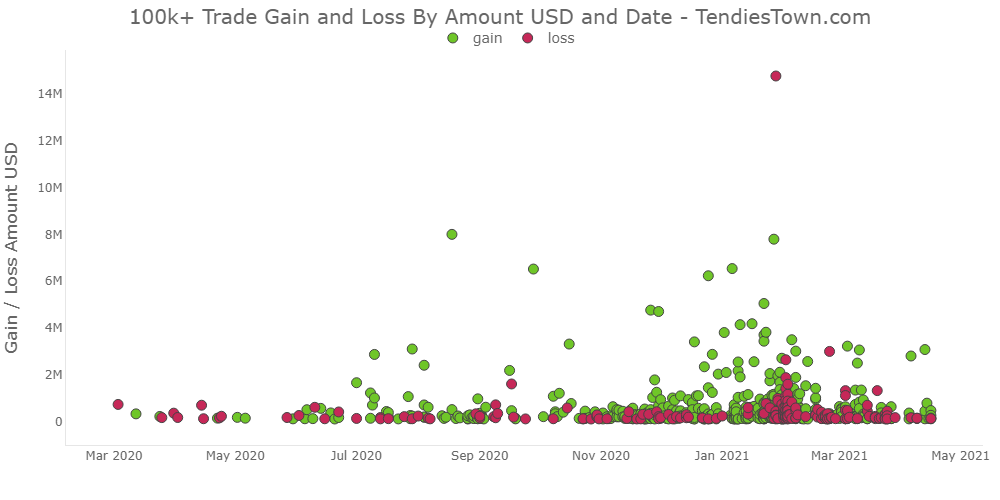
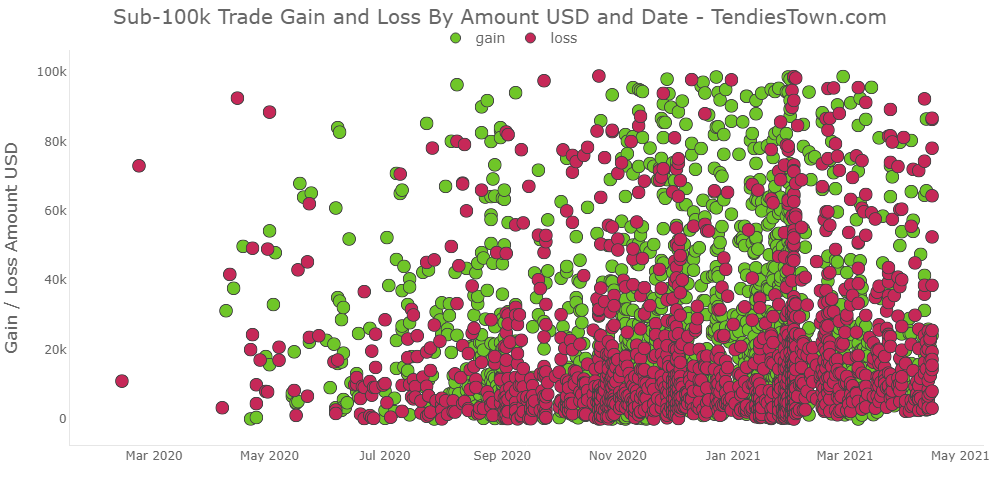
The final two scatter charts below allow relative comparison of individual gains and losses to others by date and amount.
The first chart shows only gains and losses greater than 100k. This view highlights the handful of large outliers. These are some seriously big amounts considering these are retail investors. Cheers to big gains and condolences to big losses!
The second chart shows shows gains below 100k and highlights how most of the gains and losses are below 50k.